Troubleshooting Guide
Copy page
Learn how to diagnose and resolve issues when something breaks in your Inkeep agent system.
Overview
This guide provides a structured methodology for debugging problems across different components of your agent system.
Step 1: Check the Timeline
The timeline is your first stop for understanding what happened during a conversation or agent execution. Navigate to the Traces sections to view in depth details per conversation. Within each conversation, you'll find an error card that is clickable whenever something goes wrong during agent execution.
What to Look For
- Execution flow: Review the sequence of agent actions and tool calls
- Timing: Check for delays or bottlenecks in the execution
- Agent transitions: Verify that transfers and delegations happened as expected
- Tool usage: Confirm that tools were called correctly and returned expected results
- Error cards: Look for red error indicators in the timeline and click to view detailed error information
Error Cards in the Timeline
Clicking on this error card reveals:
- Error type: The specific category of error (e.g., "Agent Generation Error")
- Exception stacktrace: The complete stack trace showing exactly where the error occurred in the code
This detailed error information helps you pinpoint exactly what went wrong and where in your agent's execution chain.
Copy Trace for Debugging
The Copy Trace button in the timeline view allows you to export the entire conversation trace as JSON. This is particularly useful for offline analysis and debugging complex flows.
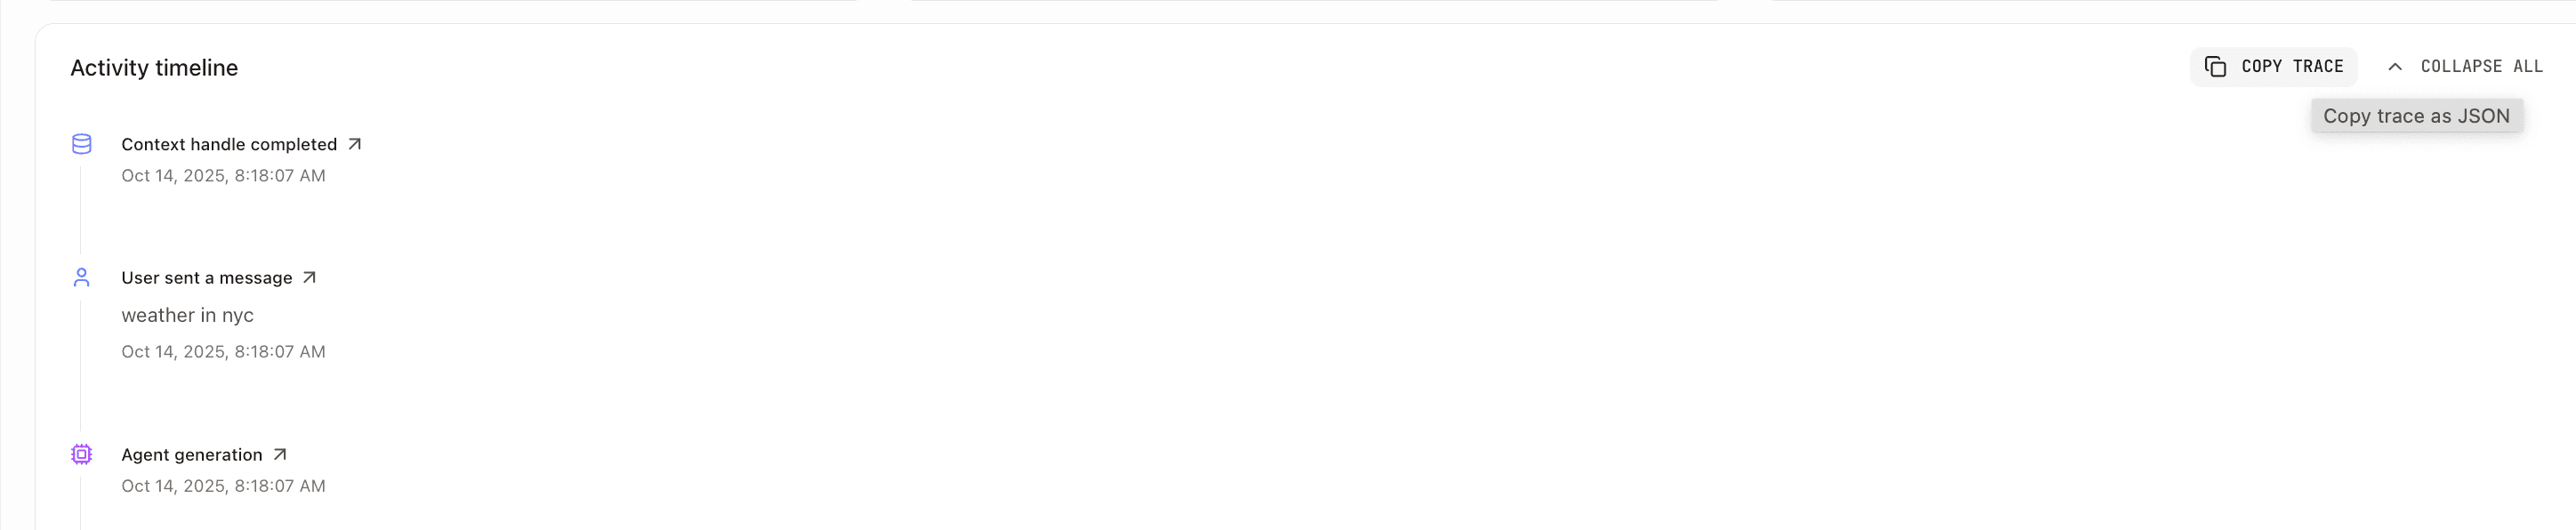
What's Included in the Trace Export
When you click Copy Trace, the system exports a JSON object containing:
How to Use Copy Trace
- Navigate to the Traces section in the management UI
- Open the conversation you want to debug
- Click the Copy Trace button at the top of the timeline
- The complete trace JSON is copied to your clipboard
- Paste it into your preferred tool for analysis
This exported trace contains all the activities shown in the timeline, making it easy to share complete execution context with team members or support.
Step 2: Check SigNoz
SigNoz provides distributed tracing and observability for your agent system, offering deeper insights when the built-in timeline isn't sufficient.
Accessing SigNoz from the Timeline
You can easily access SigNoz directly from the timeline view. In the Traces section, click on any activity in the conversation timeline to view its details. Within the activity details, you'll find a "View in SigNoz" button that takes you directly to the corresponding span in SigNoz for deeper analysis.
What SigNoz Shows
- Distributed traces: End-to-end request flows across services
- Performance metrics: Response times, throughput, and error rates
Key Metrics to Monitor
- Agent response times: How long each agent takes to process requests
- Tool execution times: Performance of MCP servers and external APIs
- Error rates: Frequency and types of failures
Agent Stopped Unexpectedly
StopWhen Limits Reached
If your agent stops mid-conversation, it may have hit a configured stopWhen limit:
- Transfer limit reached: Check
transferCountIson your Agent or Project - agent stops after this many transfers between Sub Agents - Step limit reached: Check
stepCountIson your Sub Agent or Project - execution stops after this many tool calls + LLM responses
How to diagnose:
- Check the timeline for the last activity before stopping
- Look for messages indicating limits were reached
- Review your stopWhen configuration in Agent/Project settings
How to fix:
- Increase the limits if legitimate use case requires more steps/transfers
- Optimize your agent flow to use fewer transfers
- Investigate if agent is stuck in a loop (limits working as intended)
See Configuring StopWhen for more details.
Local environment not starting
If pnpm dev fails or services aren't reachable, the most common cause is that pnpm setup-dev hasn't been run (or Docker containers have stopped).
How to fix:
- Ensure Docker Desktop (or Docker daemon) is running
- Run
pnpm setup-dev— it will start any stopped databases, apply pending migrations, and ensure the admin user exists - Run
pnpm devagain
For the quickstart template, the same applies: run pnpm setup-dev from the workspace root before pnpm dev.
Port conflicts
If pnpm setup-dev reports that ports 5432, 5433, or 5434 are in use by another Docker Compose project, stop that project first:
The setup script tells you the exact project name and command. After stopping the conflicting project, re-run pnpm setup-dev.
Check service logs (local development)
When running pnpm dev from your quickstart workspace, you will see an interactive terminal interface. This interface allows you to inspect the logs of each running service. You can navigate between services using the up and down arrow keys.
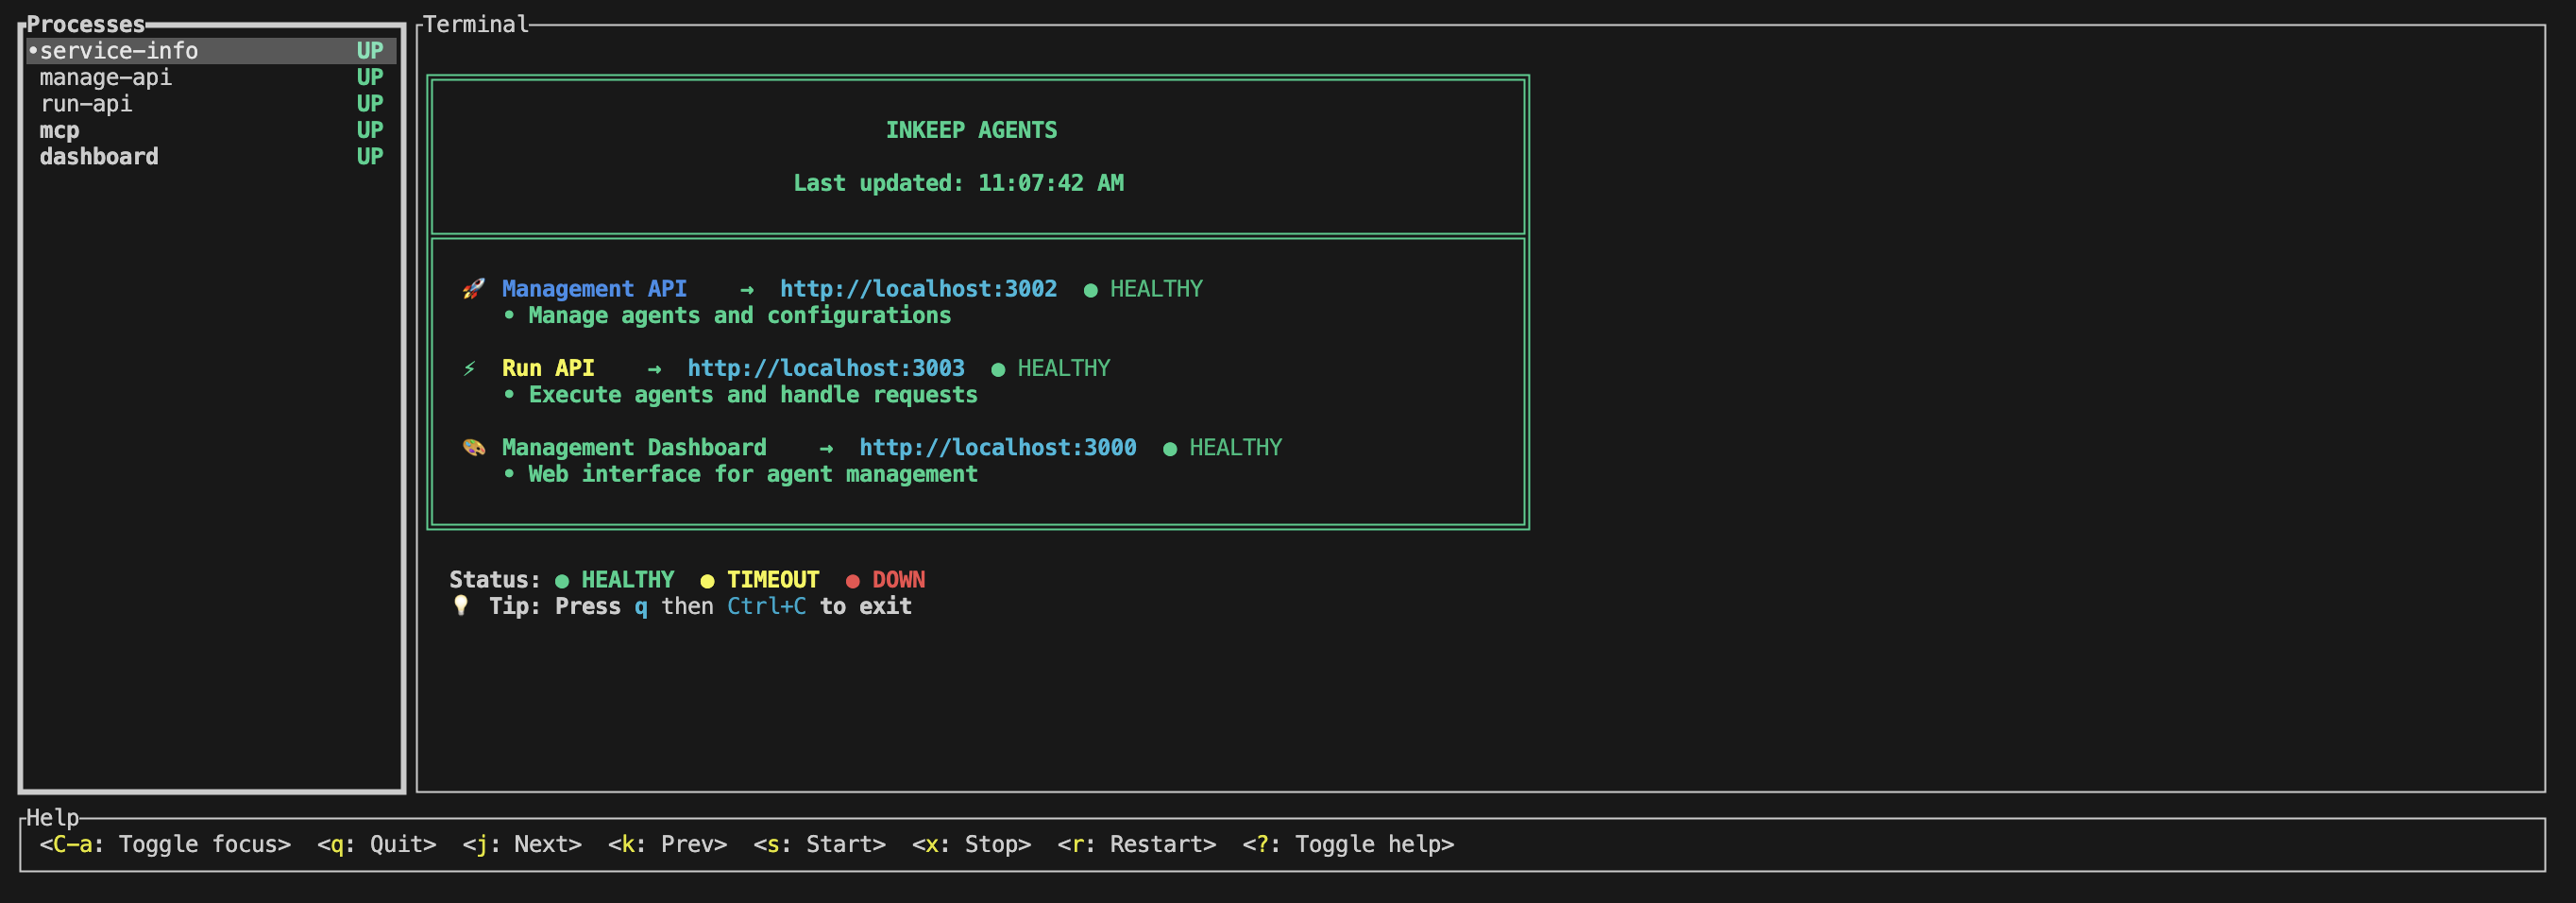
- The
service-infotab displays the health of each running service. - The
manage-apitab contains logs for all database operations. This is useful primarily for debugging issues withinkeep push. - The
run-apitab contains logs for all agent execution and tool calls. This is useful for debugging issues with your agent's behavior. - The
mcptab contains logs for your custom MCP servers. - The
dashboardtab displays logs for the Visual Builder dashboard.
To terminate the running services, click press q or esc in the terminal.
CLI Issues
Login fails or browser shows "connection refused"
- Verify the dashboard is running (
inkeep devor check Docker services) - Check the manage UI URL in your profile:
inkeep profile current - Common cause: profile has a wrong port — re-create with
inkeep profile add
"Device code expired" during login
This usually means the manage UI was unreachable when you tried to approve the device code.
- Check:
inkeep profile current— verify the Manage UI URL is correct and accessible in your browser - For local development, the default manage UI runs on
http://localhost:3000
Push fails with authentication errors
- Ensure you've logged in for the active profile:
inkeep login - Local profiles with
credential: nonedon't require login — the local server accepts unauthenticated requests - Check which profile is active:
inkeep profile current
Authentication Issues (Local Development)
If auto-login isn't working when you open http://localhost:3000:
- You recently logged out: After clicking "Log out", a
dev-logged-outcookie prevents auto-login so you can test login flows. To restore auto-login, clear your cookies or restart your browser. pnpm db:auth:initnot run: The admin user must exist in the database. Runpnpm db:auth:initto create it.- API not running: The auto-login proxy calls
POST /api/auth/dev-sessionon the API server. Make sure the API is running onlocalhost:3002. - Bypass secret missing from
.env: EnsureINKEEP_AGENTS_MANAGE_API_BYPASS_SECRETis set in your.envfile. The proxy uses this to authenticate with the API. Check the server console for[proxy]warnings. - Credentials missing from
.env: EnsureINKEEP_AGENTS_MANAGE_UI_USERNAMEis set in your.envfile. The password env var is only used bypnpm db:auth:initto create the admin user, not for auto-login.
Common Configuration Issues
General Configuration Issues
- Missing environment variables: Ensure all required env vars are set
- Incorrect API endpoints: Verify you're using the right URLs
- Network connectivity: Check firewall and proxy settings
- Version mismatches: Ensure all packages are compatible
MCP Server Connection Issues
- MCP not able to connect:
- Check that the MCP server is running and accessible
- 401 Unauthorized errors:
- Verify that credentials are properly configured and valid
- Connection timeouts:
- Ensure network connectivity and firewall settings allow connections
AI Provider Configuration Problems
-
AI Provider key not defined or invalid:
- Ensure you have one of these environment variables set:
ANTHROPIC_API_KEY,OPENAI_API_KEY, orGOOGLE_GENERATIVE_AI_API_KEY - Verify the API key is valid and has sufficient credits
- Check that the key hasn't expired or been revoked
- Ensure you have one of these environment variables set:
-
GPT-5 access issues:
- Individual users cannot access GPT-5 as it requires organization verification
- Use GPT-4 or other available models instead
- Contact OpenAI support if you need GPT-5 access for your organization
Credit and Rate Limiting Issues
-
Running out of credits:
- Monitor your OpenAI usage and billing
- Set up usage alerts to prevent unexpected charges
-
Rate limiting by AI providers:
- Especially common with high-frequency operations like summarizers
- Monitor your API usage patterns and adjust accordingly
Context Fetcher Issues
- Context fetcher timeouts:
- Check that external services are responding within expected timeframes
Error Retry Behavior
When calling agents the system automatically retries certain errors using exponential backoff.
The following errors are automatically retried:
| Status Code | Meaning |
|---|---|
429 | Too Many Requests (rate limited) |
500 | Internal Server Error |
502 | Bad Gateway |
503 | Service Unavailable |
504 | Gateway Timeout |
These transient network issues are also automatically retried:
- Network connectivity failures
- Connection timeouts
ECONNRESET— Connection reset by peerECONNREFUSED— Connection refused (network level)ENOTFOUND— DNS lookup failures- Fetch/request failures