Using SigNoz for Observability
Copy page
Complete guide to using SigNoz for observability, monitoring, tracing in the Inkeep Agent Framework
SigNoz is a full-stack observability platform that provides distributed tracing so that you can track requests across multiple agents and services.
Quick Start
Before using SigNoz, ensure it's properly set up and running. For setup instructions, see the Quick Start guide.
Using SigNoz UI
The Traces page provides detailed request tracing:
Viewing Traces
The SigNoz traces interface provides comprehensive visibility into your agent operations:
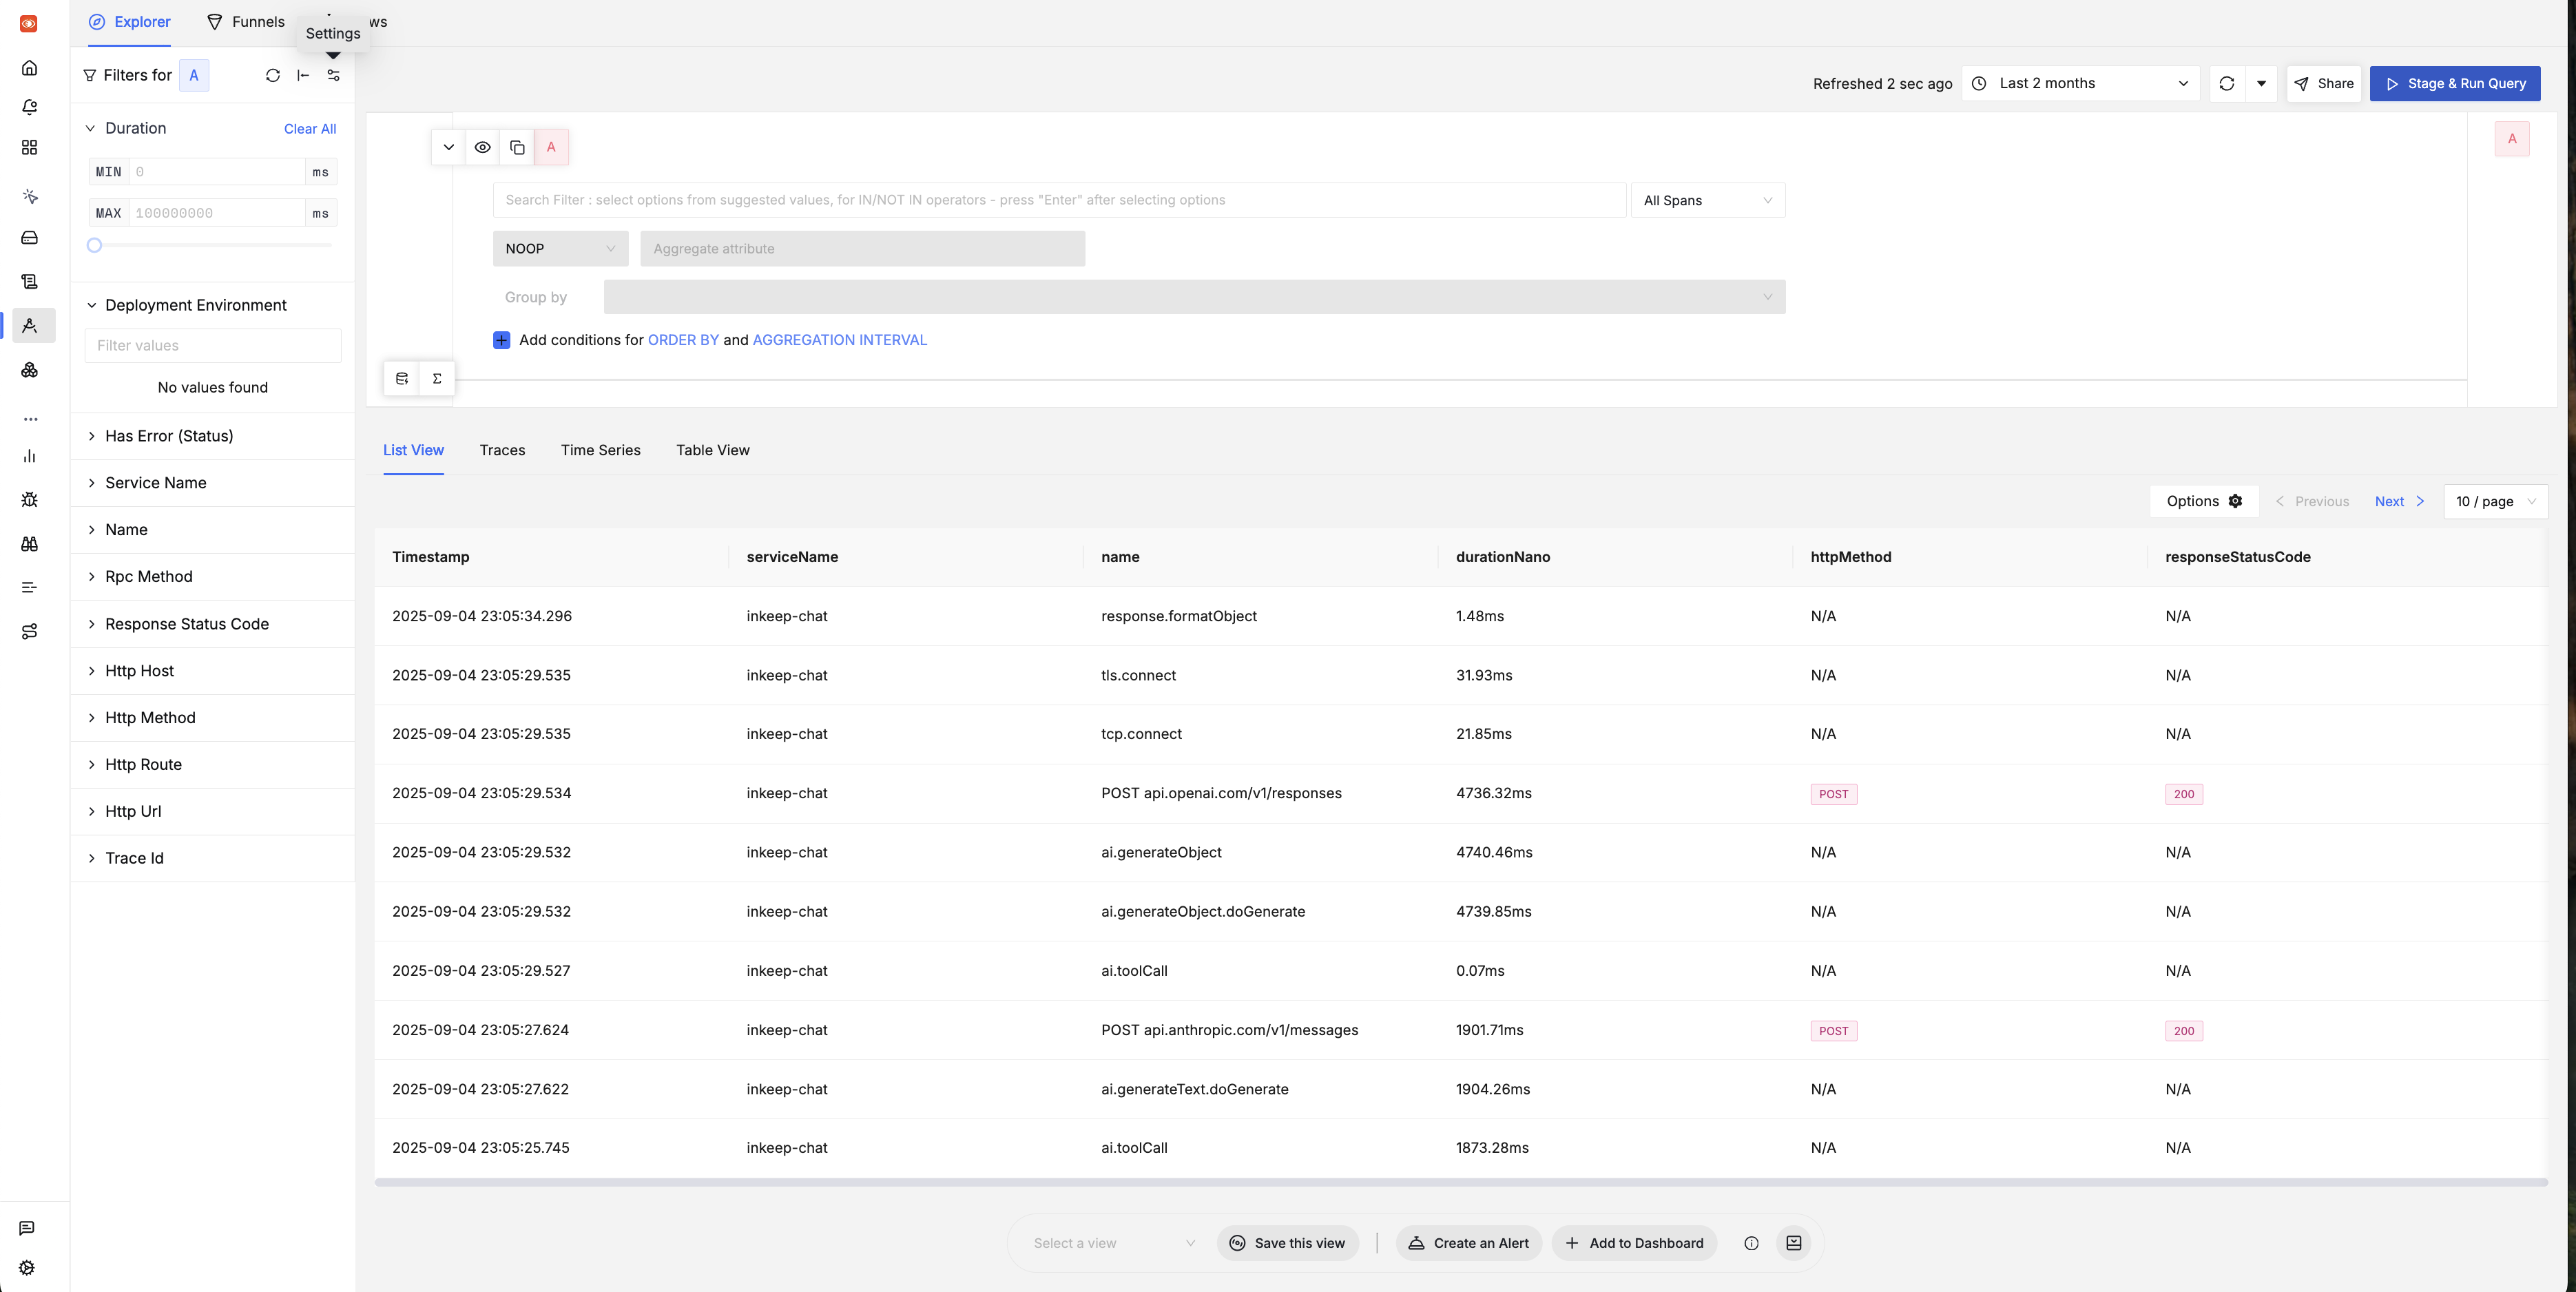
The traces explorer shows:
- Timestamp: When each span occurred
- Service Name: The service that generated the span (e.g.,
inkeep-agents-run-api) - Operation Name: Specific operations like
ai.generateText,tls.connect,ai.toolCall - Duration: How long each operation took (in milliseconds)
- HTTP Method: For HTTP operations, shows the method (POST, GET, etc.)
- Response Status Code: HTTP status codes (200, 404, etc.)
Key features of the traces view:
-
Filtering Options: Use the left sidebar to filter by duration, deployment environment, service name, and more
-
Time Range Selection: Choose from preset ranges or custom time periods
-
Multiple Views: Switch between List View, Traces, Time Series, and Table View
-
Real-time Updates: Traces refresh automatically to show new data
-
Trace List: Browse all traces with filtering options
-
Trace Details: Drill down into individual traces
-
Span Timeline: See the execution flow across agents
Filtering Traces
Analyzing Individual Traces
When you click on a specific trace from the list, you'll see the detailed trace view with a flamegraph visualization:
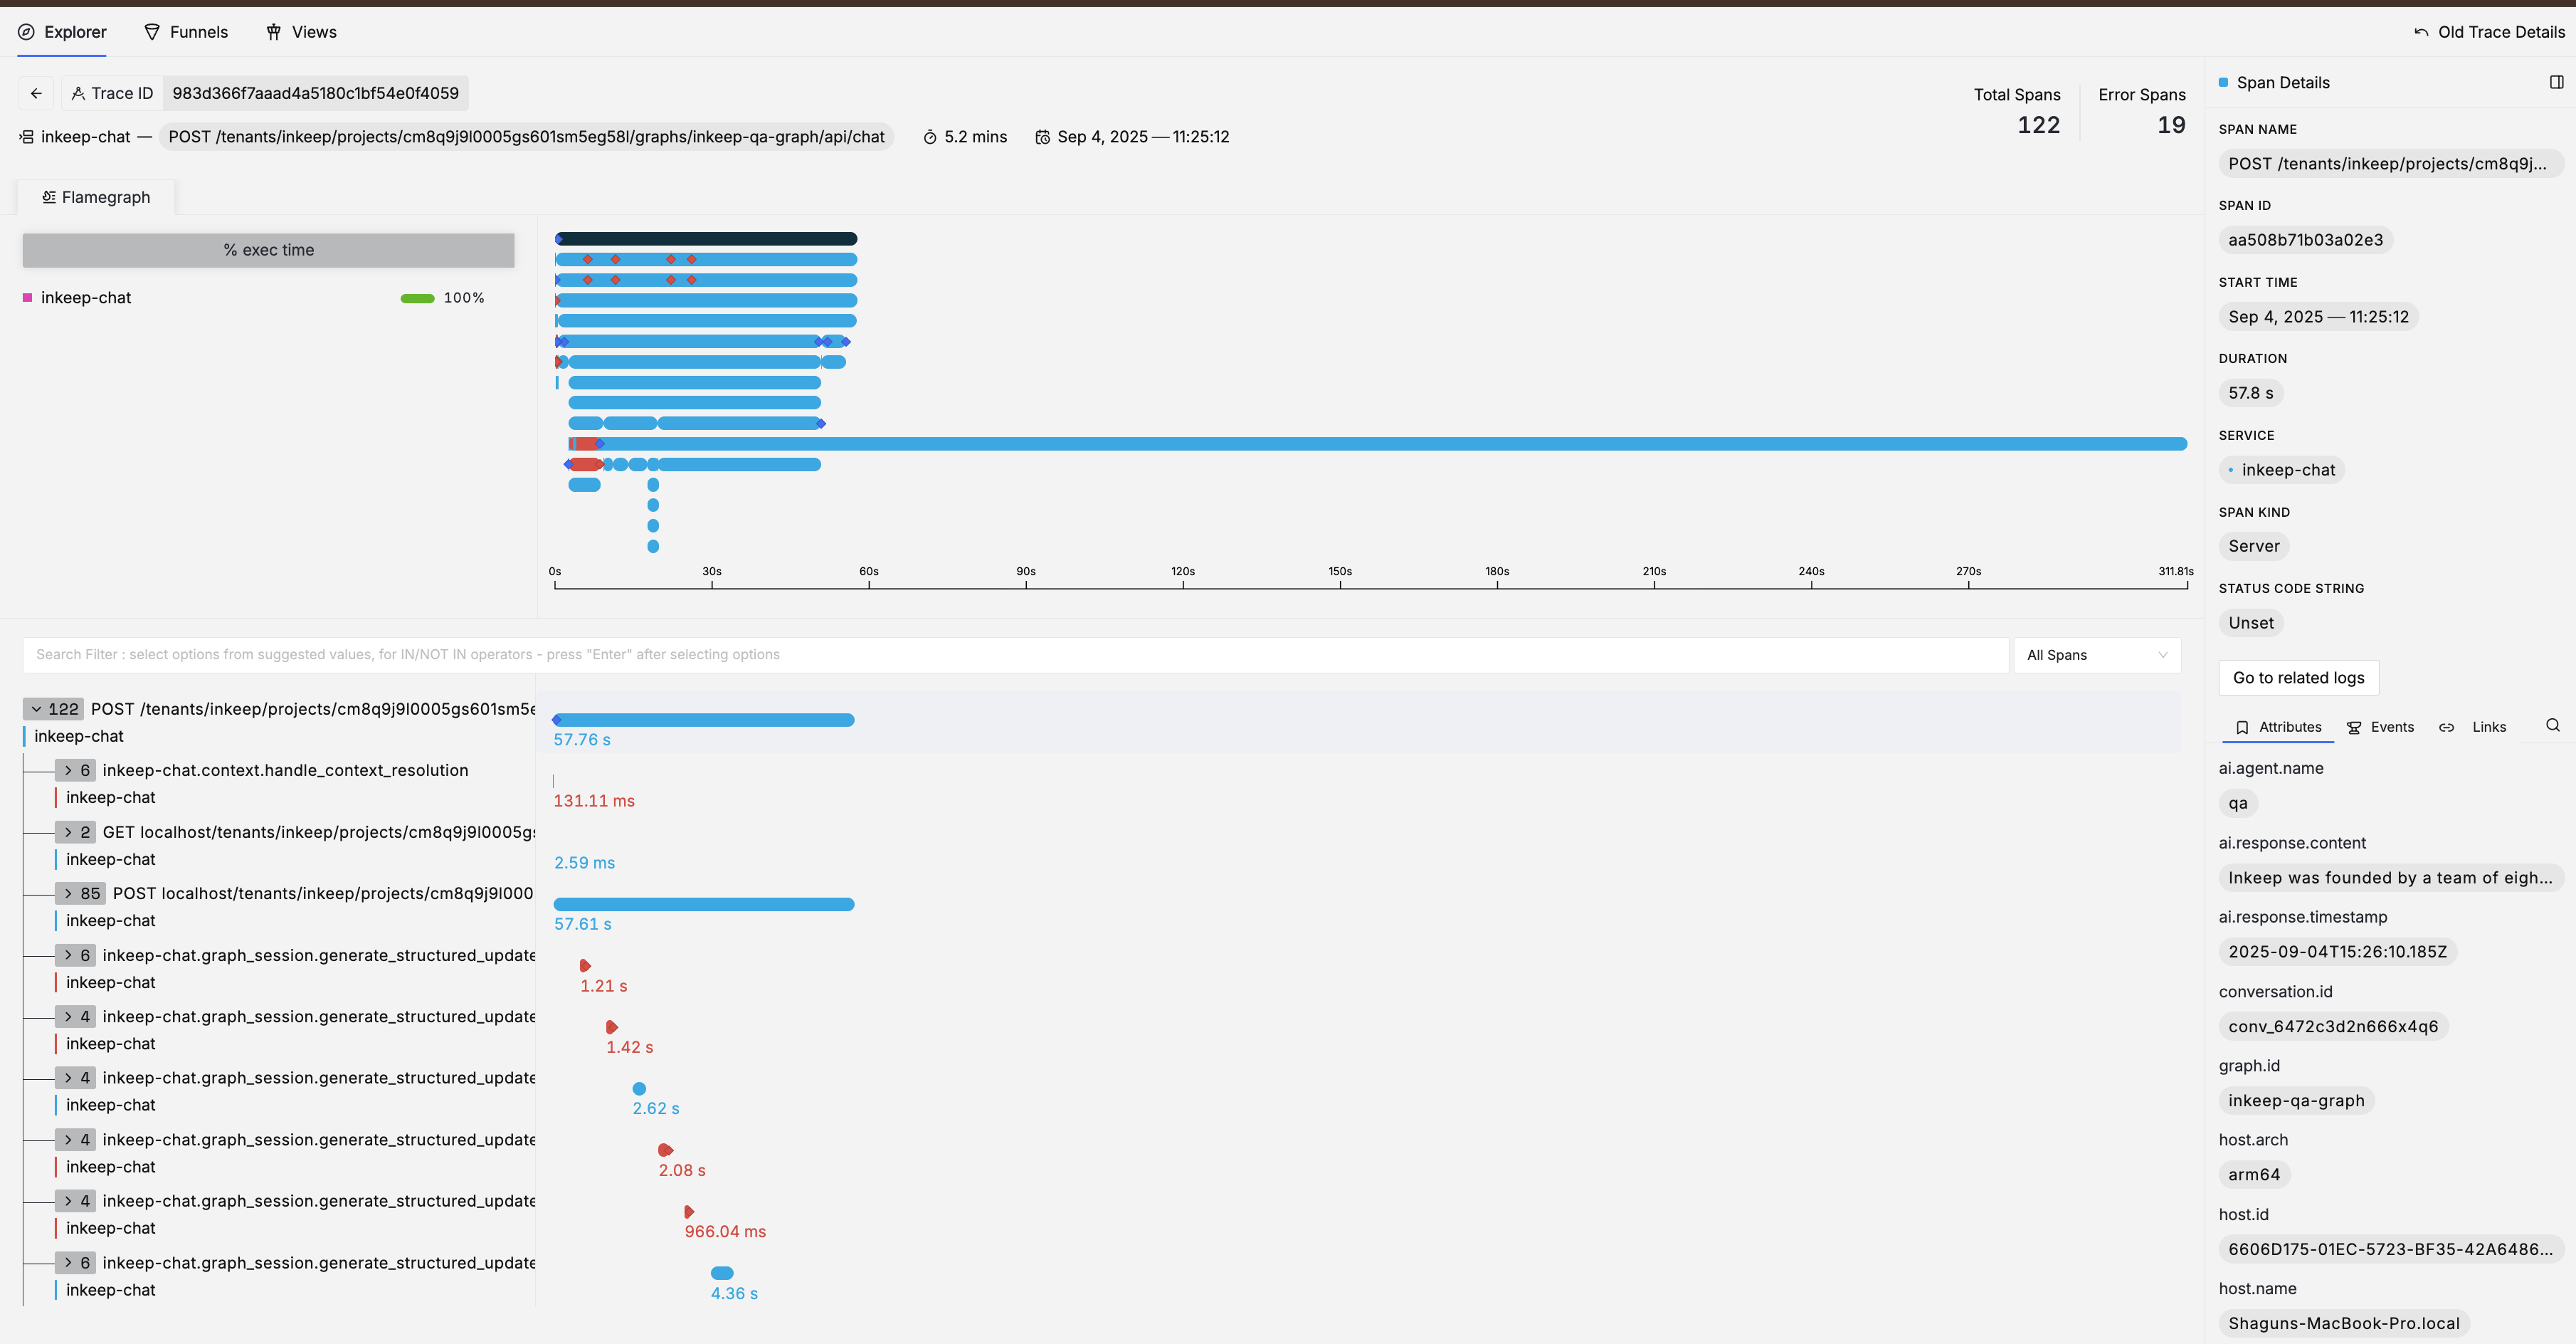
Flamegraph Visualization:
- Horizontal Bars: Each bar represents a span (operation) in your trace
- Bar Width: Proportional to the duration of the operation
- Color Coding:
- Blue bars: Successful operations
- Red bars: Operations with errors
Key Information Displayed:
- Total Spans: Total number of operations in this trace (e.g., 122)
- Error Spans: Number of spans that encountered errors (e.g., 19)
- Trace Duration: Total time for the entire trace (e.g., 5.2 mins)
- Timestamp: When the trace occurred
- Service: The primary service (e.g.,
inkeep-agents-run-api)
Span Details Panel (Right Side):
- Span Name & ID: Operation name and unique identifier
- Timing: Start time and duration
- Service & Kind: Which service and span type (Server, Client, etc.)
- Status: Success/error status code
- Attributes, Events & Links: Additional span metadata
How to Use This View:
- Identify Bottlenecks: Look for the widest bars in the flamegraph - these represent the longest-running operations
- Find Errors: Red bars indicate operations that failed - click on them to see error details
- Understand Flow: Follow the vertical hierarchy to see how operations call each other
- Analyze Performance: Use the timeline to see which operations run in parallel vs. sequentially
- Drill Down: Click on any span to see detailed attributes, events, and error information