Traces and Live Debugger
Copy page
Set up SigNoz to enable full observability with traces and live debugging capabilities for your agents.
Overview
The Inkeep Agent Framework provides powerful traces and live debugging capabilities powered by SigNoz. This gives you:
- Real-time trace visualization - See exactly how your agents execute step-by-step
- Live debugging - Debug agent conversations as they happen
- Full observability - Complete OpenTelemetry instrumentation for monitoring
- Performance insights - Identify bottlenecks and optimize agent performance
Why Set Up SigNoz?
SigNoz powers two critical features:
- Traces Interface - Visual representation of agent execution flows
- Live Debugger - Real-time debugging capabilities for agent conversations
Setup Options
You can set up SigNoz in two ways:
- Cloud Setup: Use SigNoz Cloud
- Local Setup: Run SigNoz locally using Docker
Option 1: SigNoz Cloud Setup
Step 1: Create a SigNoz Cloud Project
- Sign up at SigNoz
- Create a new project or use an existing one
Step 2: Save Your SigNoz Credentials
You'll need to collect three pieces of information from your SigNoz dashboard:
-
API Key:
- Navigate to Settings → Workspace Settings → API Keys → New Key
- Choose any role (Admin, Editor, or Viewer) - Viewer is sufficient for observability
- Set the expiration field to "No Expiry" to prevent the key from expiring
- Copy the generated API key
-
Ingestion Key:
- Navigate to Settings → Workspace Settings → Ingestion
- Set the expiration field to "No Expiry" to prevent the key from expiring
- Copy the ingestion key
-
SigNoz URL:
- Copy the URL from your browser's address bar
- It will look like:
https://<your-organization>.signoz.cloud
Step 3: Configure Your Root .env File
Step 4: Verify Cloud Setup
-
Restart your development environment:
-
Generate some traces by interacting with your agents
-
Open your SigNoz cloud dashboard and navigate to "Traces" to see your agent traces
Option 2: Local SigNoz Setup
Prerequisites
- Docker installed on your machine
Step 1: Clone the Optional Services Repository
Clone the Inkeep optional local development services repository:
Step 2: Configure SigNoz Credentials (Optional)
In the agents-optional-local-dev repository, you can optionally set credentials by adding these to your .env file:
Step 3: Start SigNoz Services
Run the following command to start SigNoz and related services:
This will start:
- SigNoz frontend (accessible at
http://localhost:3080) - SigNoz query service
- SigNoz OTEL collector
- ClickHouse database
When you visit http://localhost:3080, you can log in using the credentials you configured above.
Step 4: Configure Environment Variables
In your root project directory (of my-agent-directory), update your .env file:
To get your SigNoz API key:
- Open SigNoz at
http://localhost:3080 - Navigate to Settings → Account Settings → API Keys → New Key
- Create a new API key or copy an existing one.
- Choose any role (Admin, Editor, or Viewer) - Viewer is sufficient for observability
- Set the expiration field to "No Expiry" to prevent the key from expiring
Step 5: Verify Setup
-
Restart your Inkeep agents:
-
Make some requests to your agents to generate traces
-
Open SigNoz at
http://localhost:3080and navigate to the "Traces" section to see your agent traces
Viewing Traces and Using the Live Debugger
Once SigNoz is set up, you can access traces and live debugging in two ways:
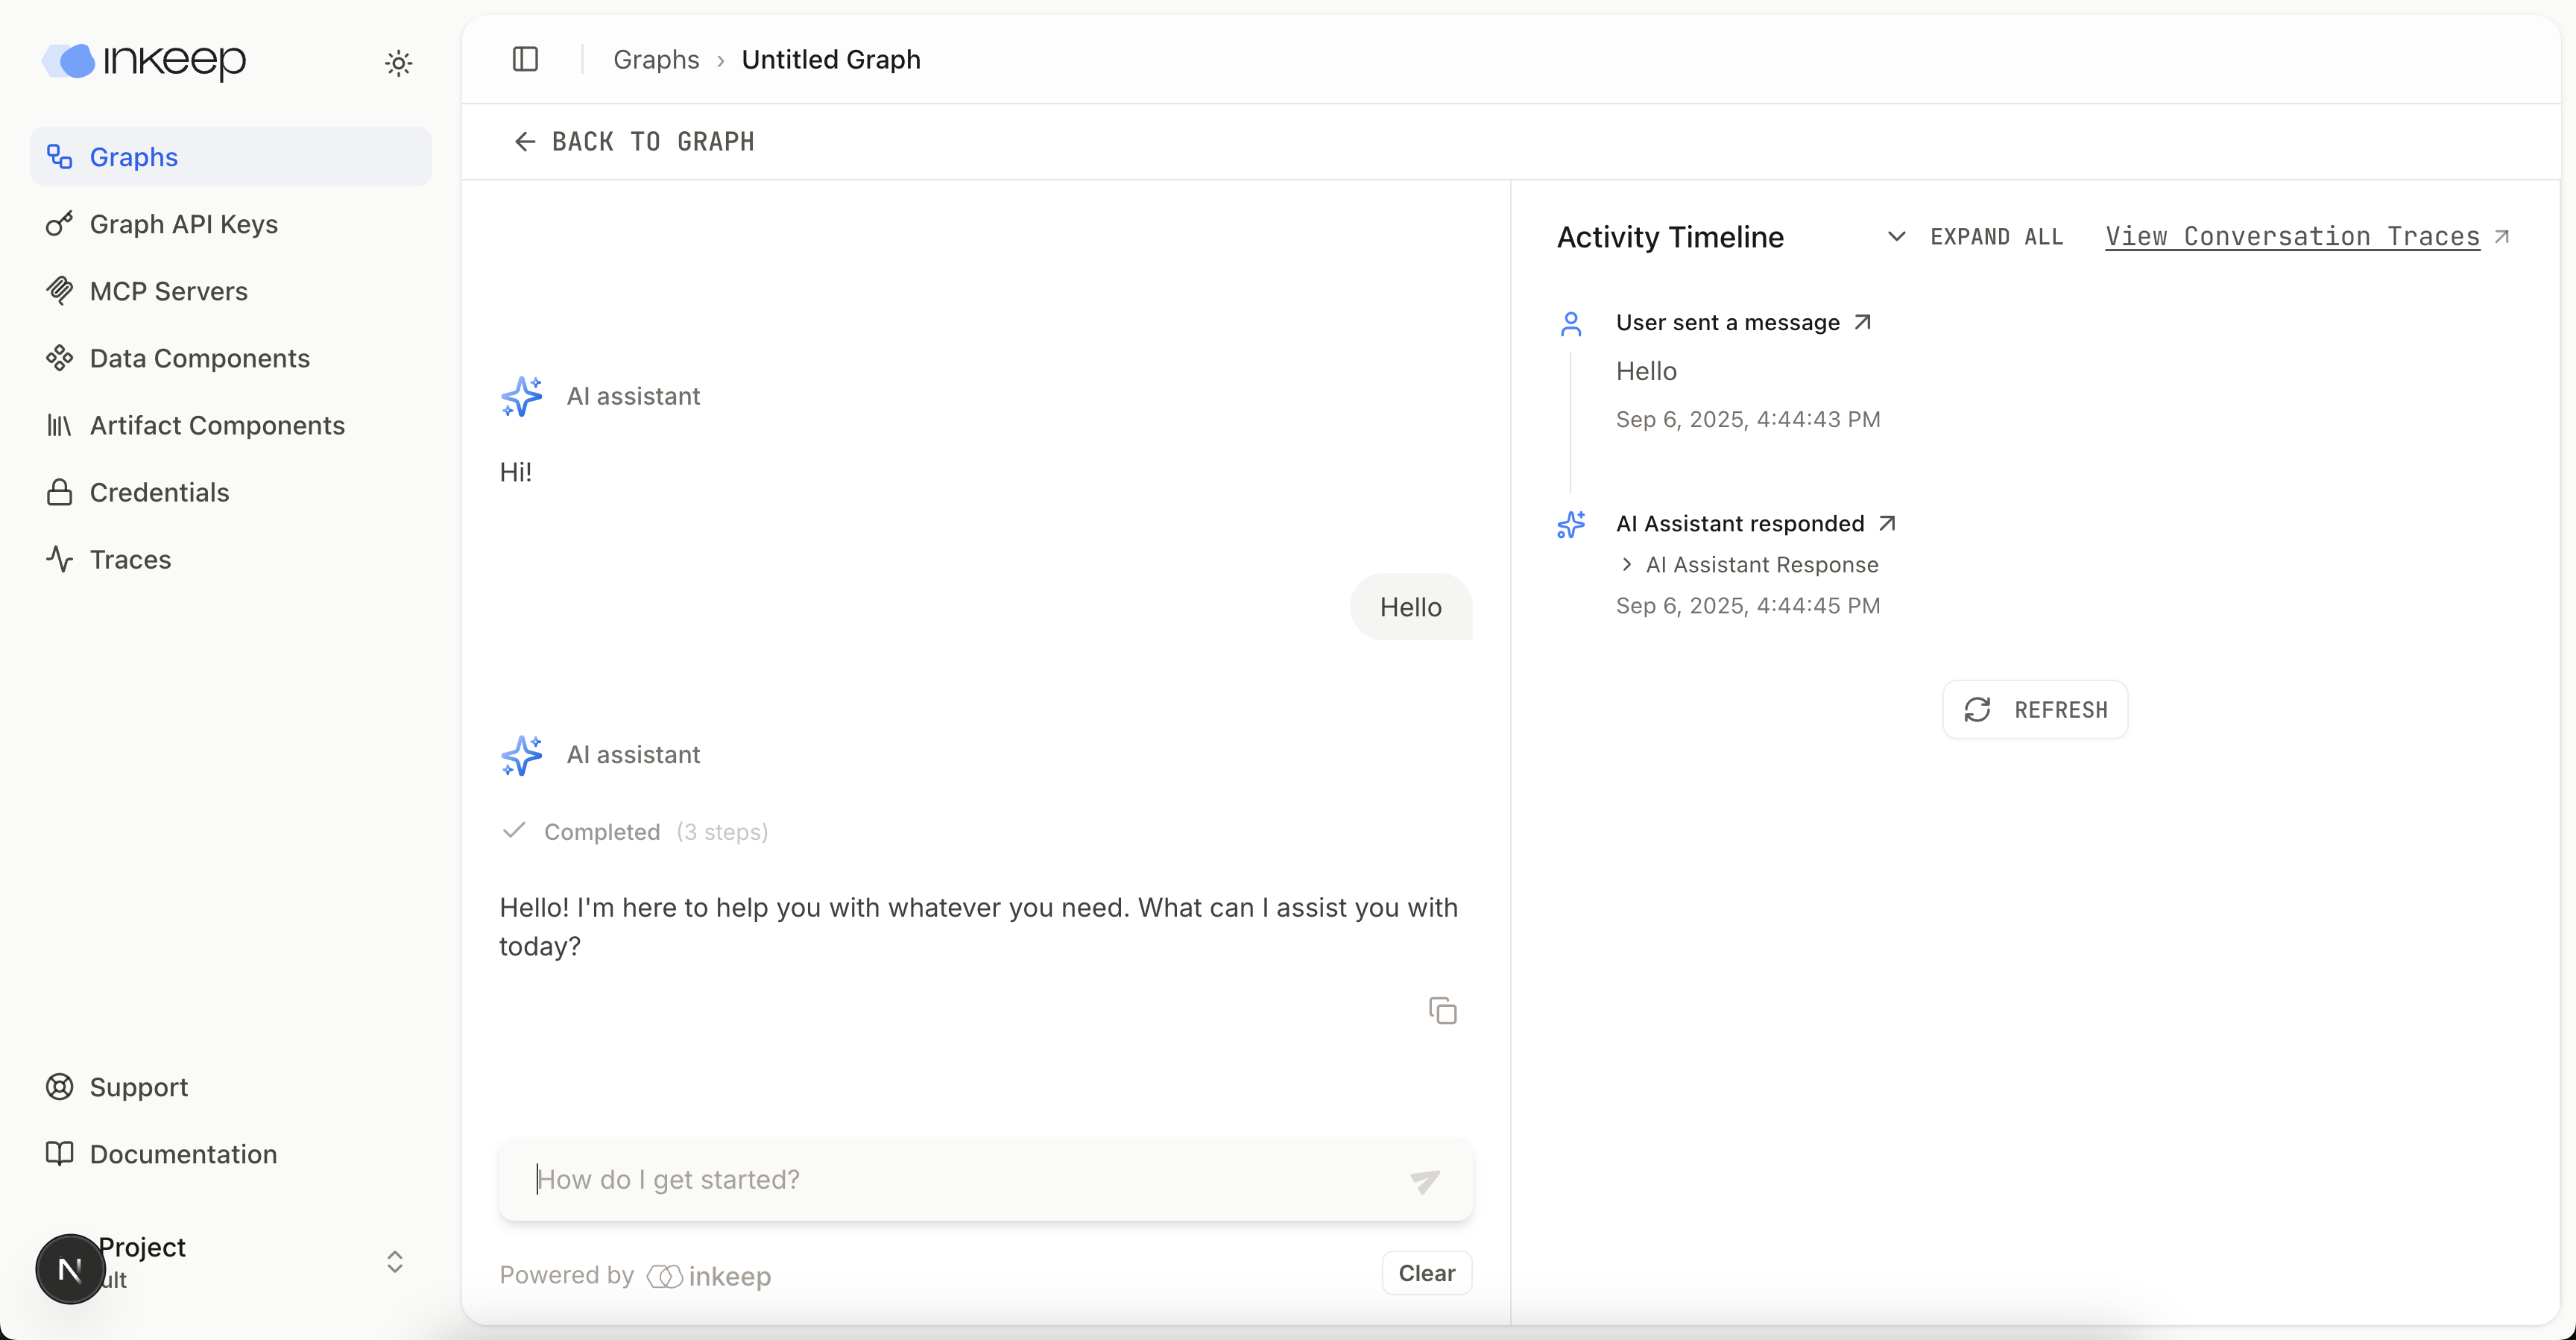
1. Visual Builder Traces Interface
If you're using the Visual Builder:
- Open your agent project in the Visual Builder
- Navigate to the Traces section
- You'll see real-time traces of your agent executions
- Click on any trace to see detailed execution flow and timing
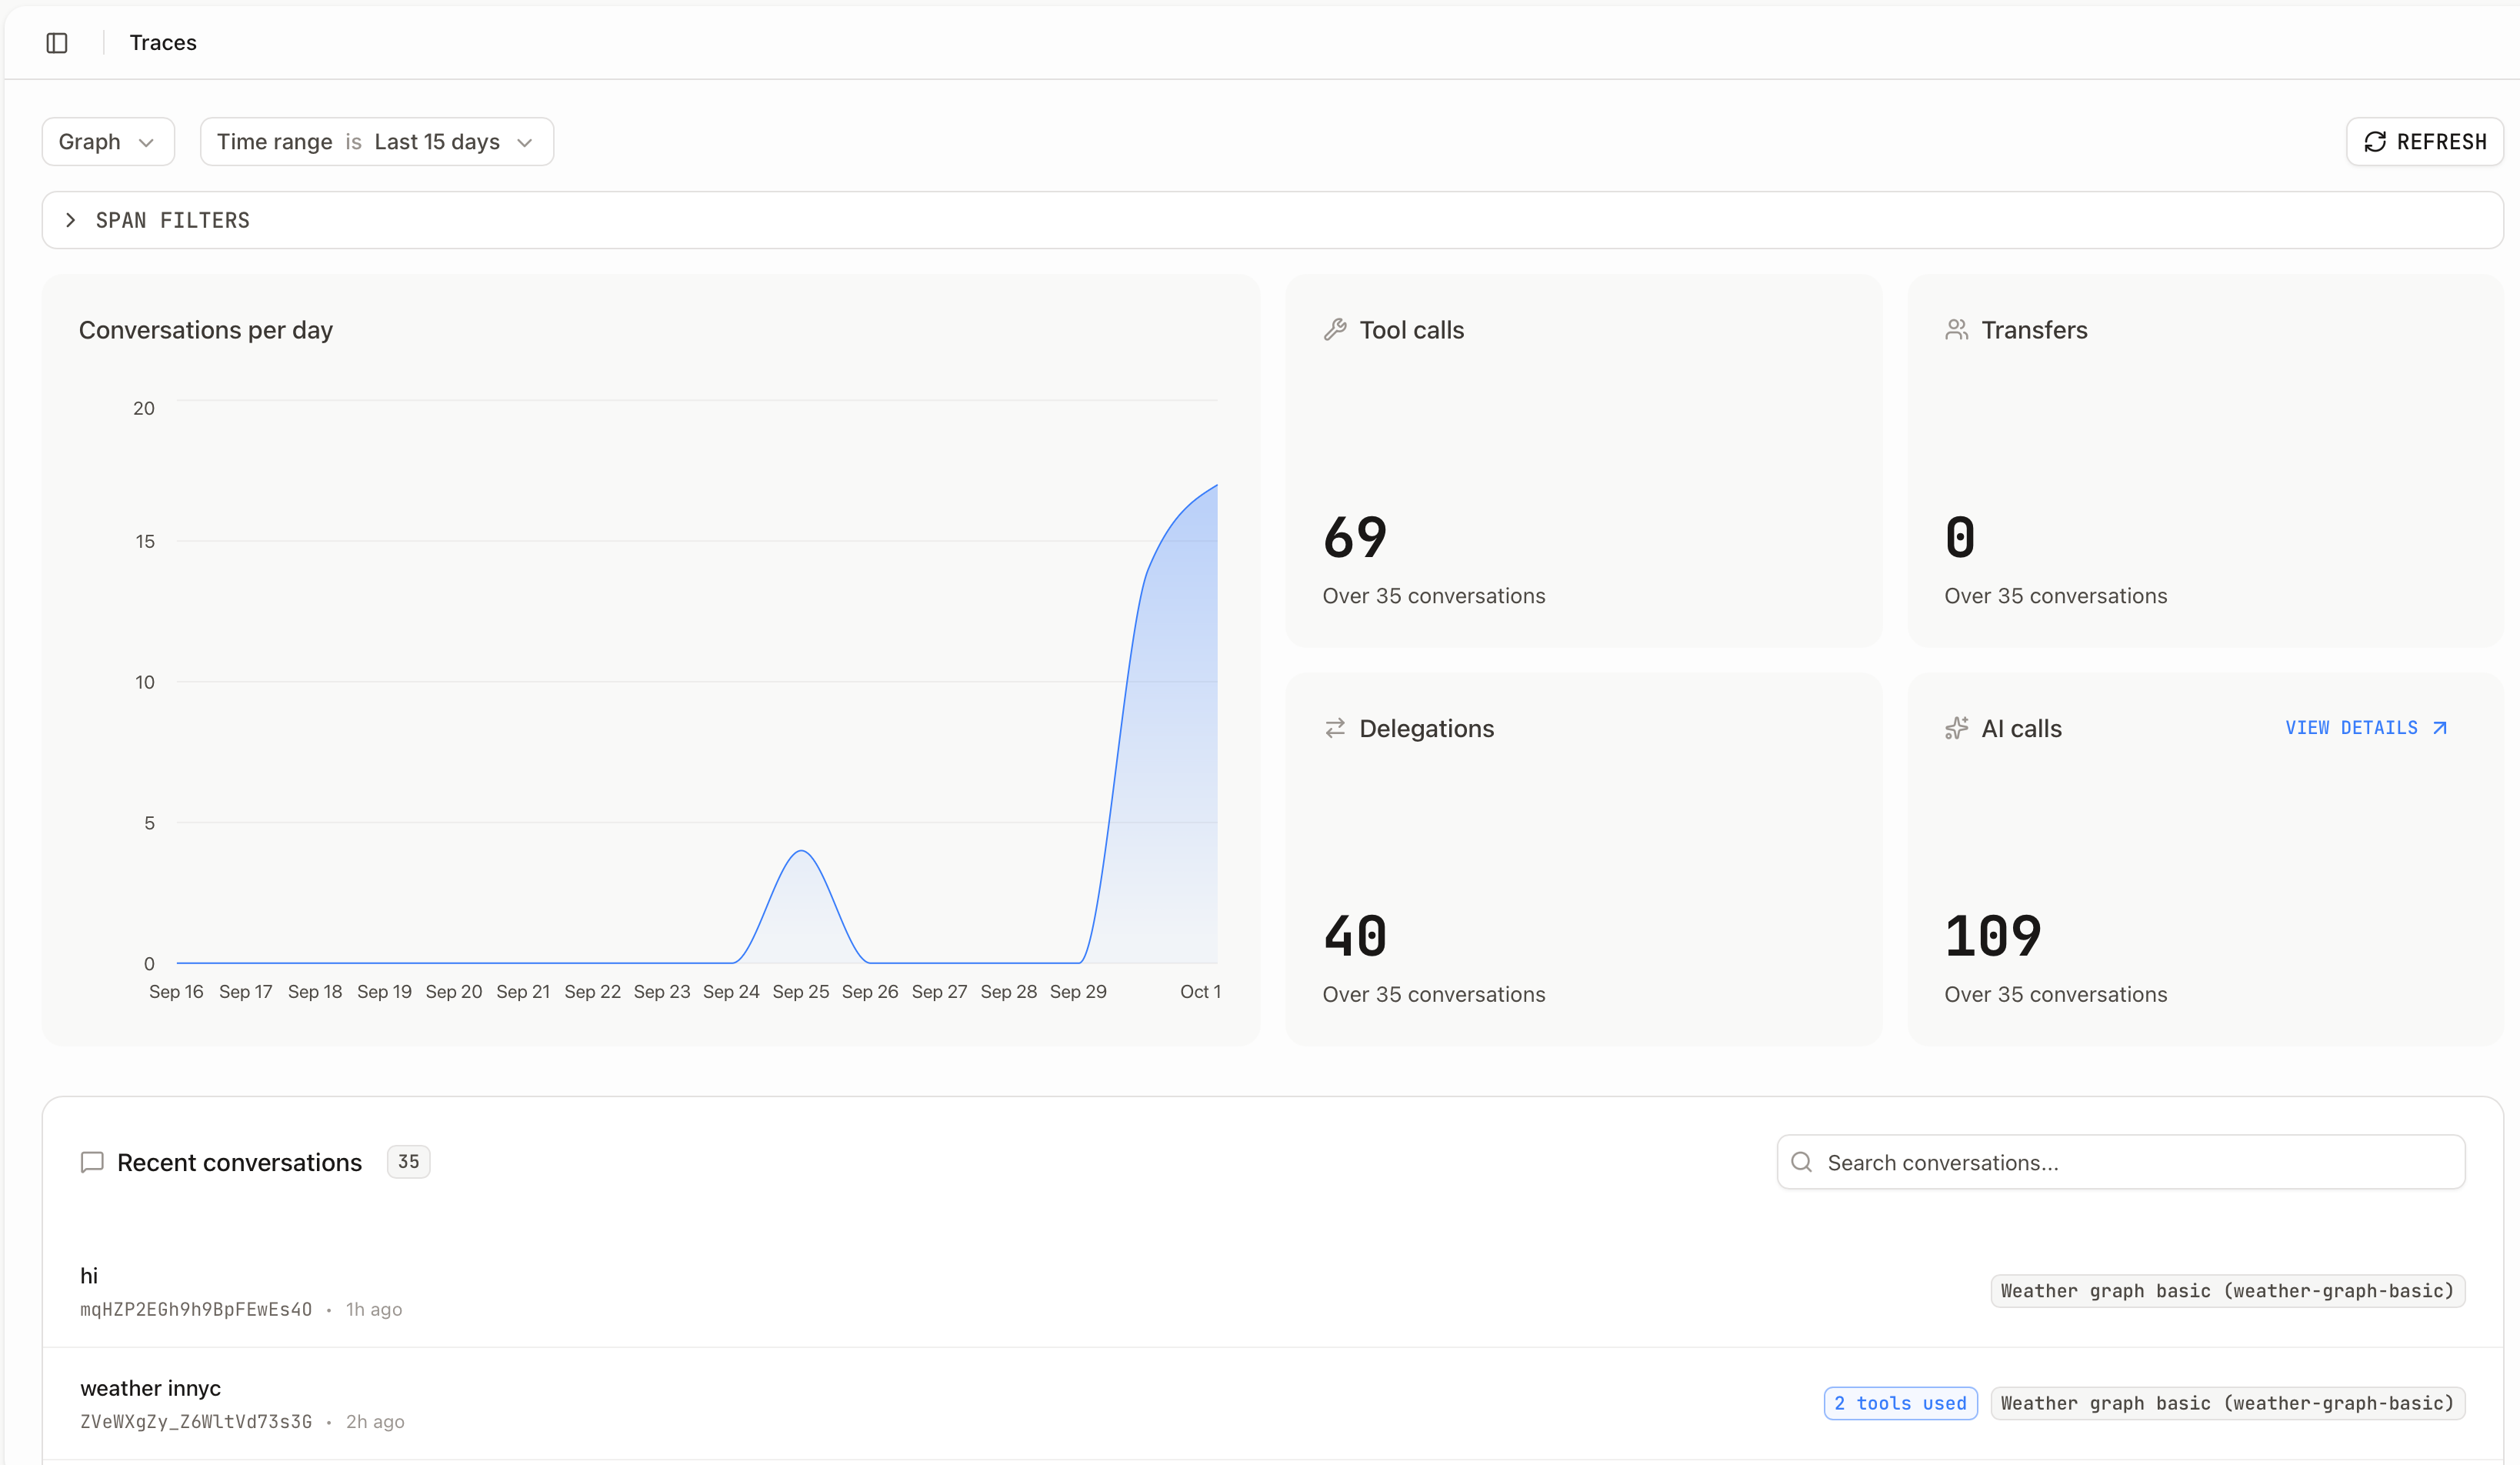
The traces overview shows conversation metrics and recent activity:
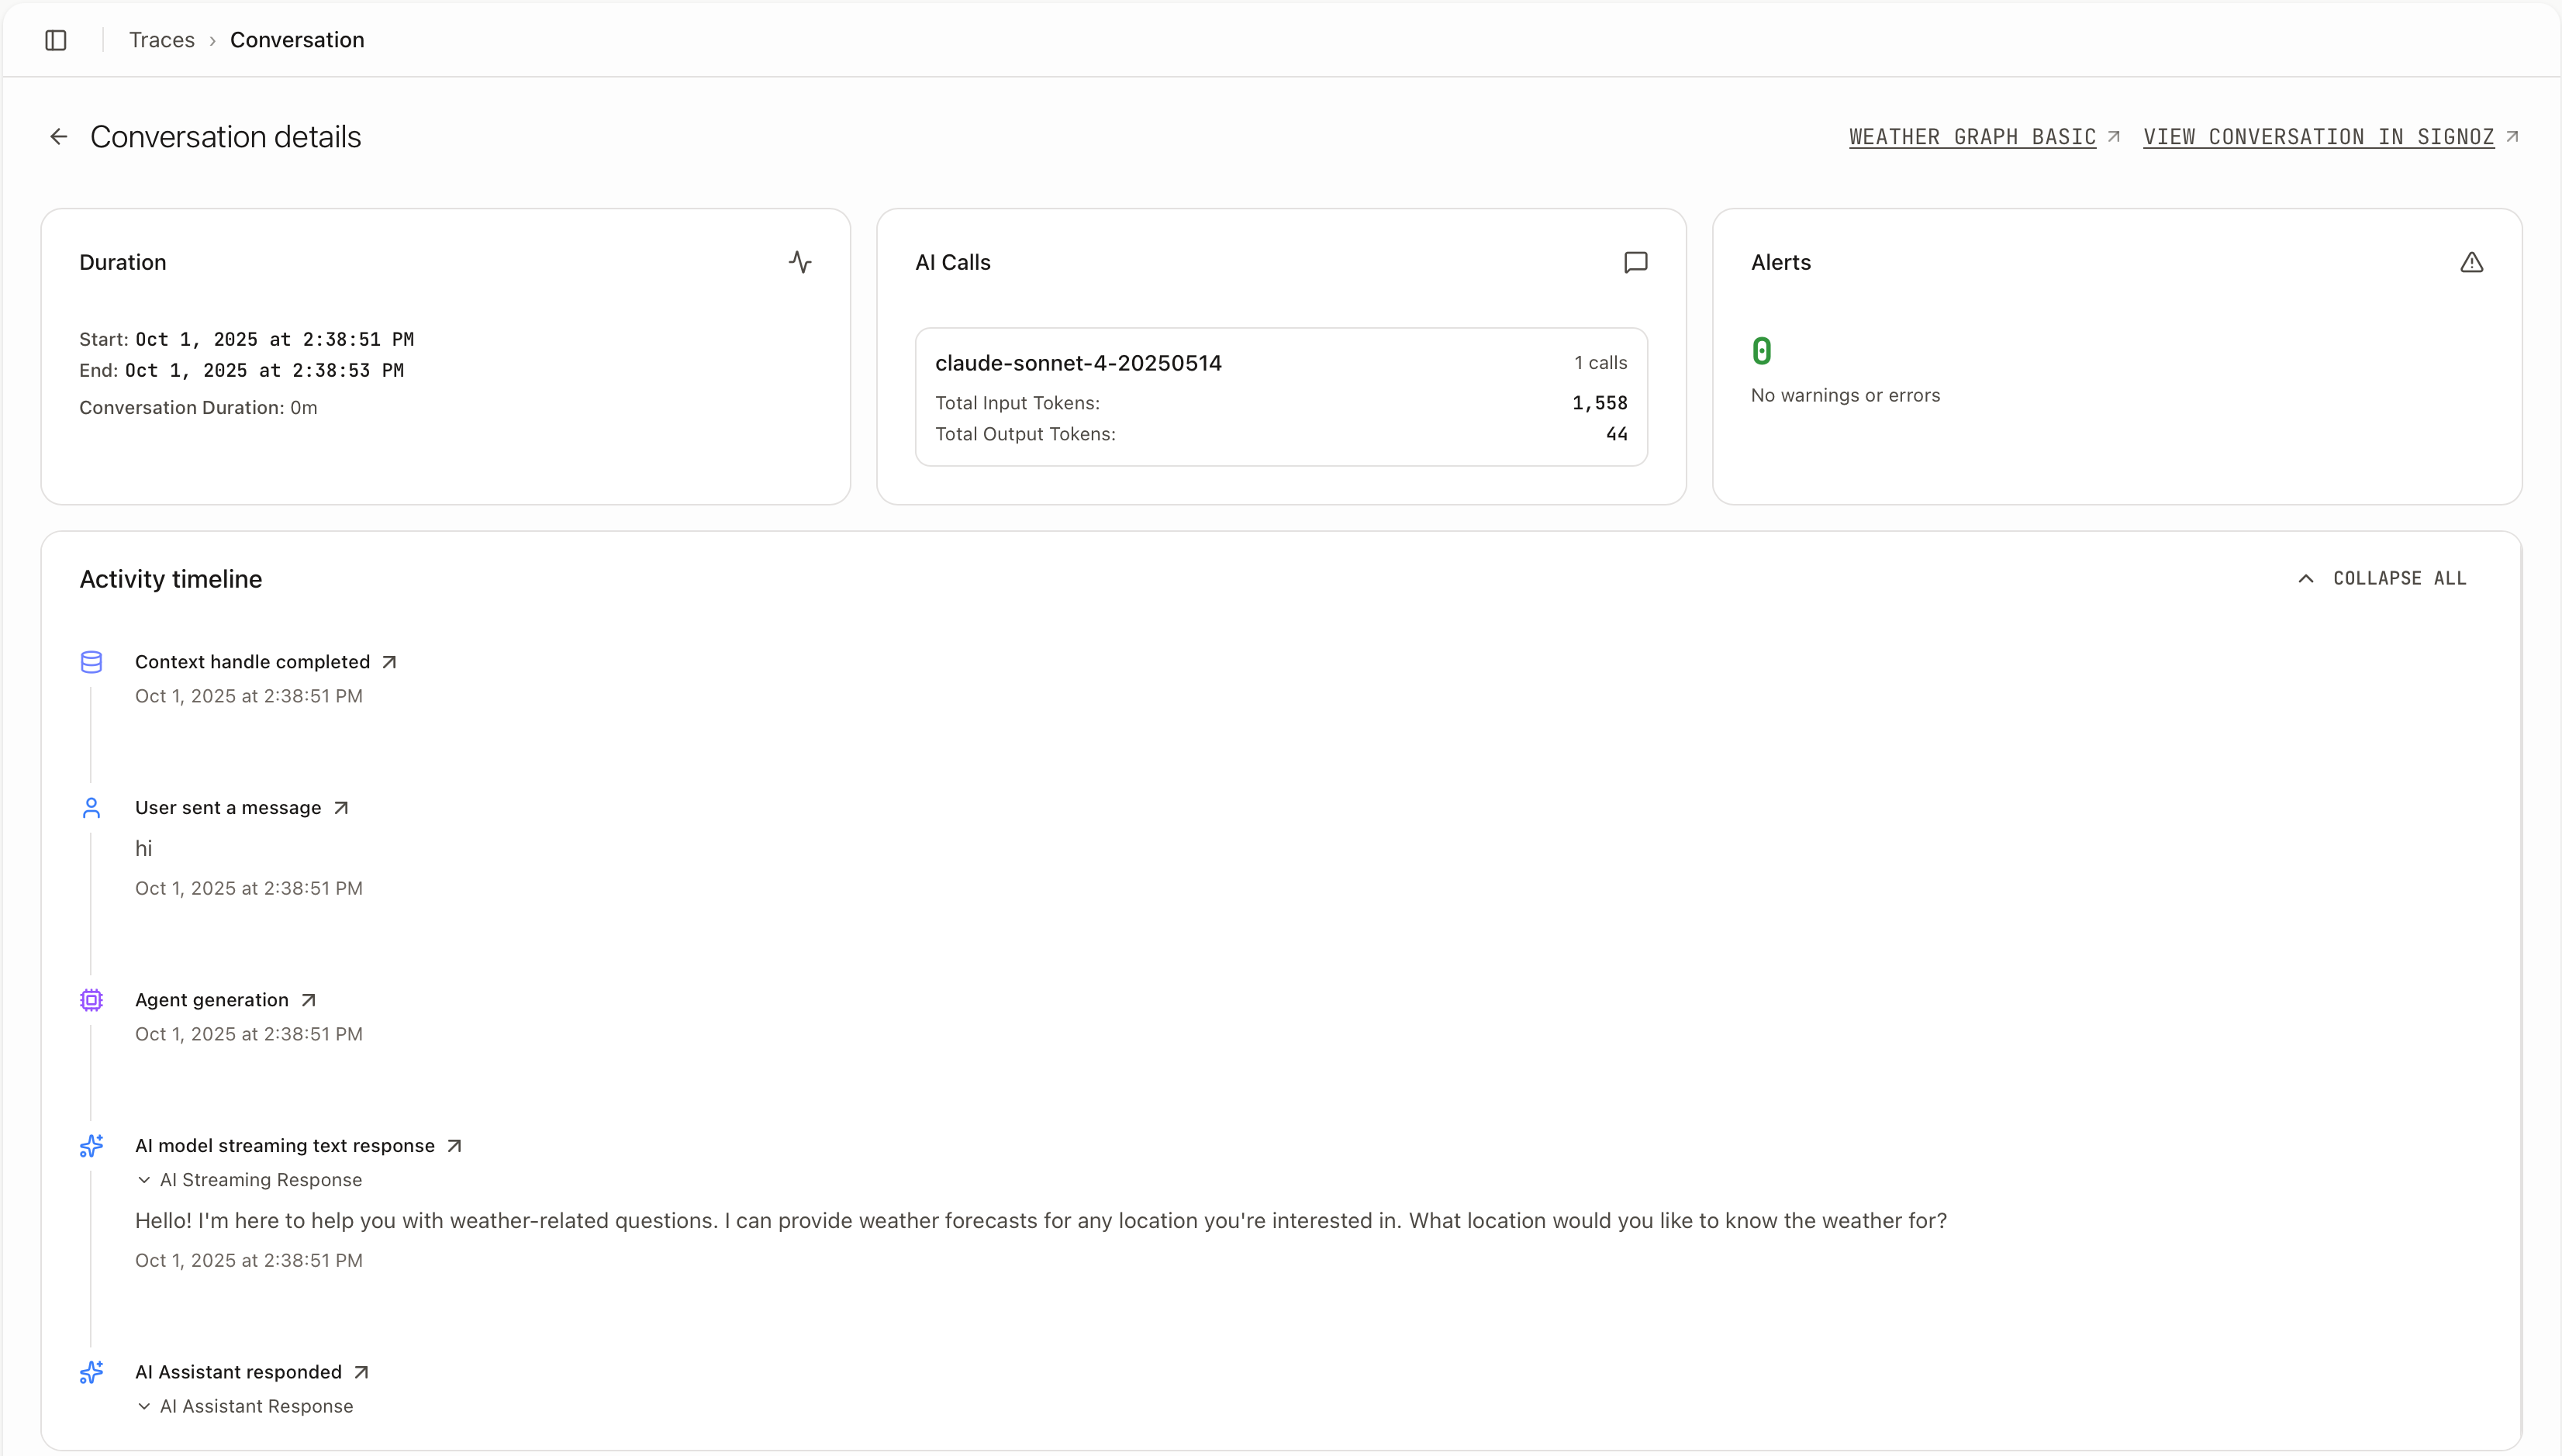
Click on any conversation to see detailed execution flow:
2. SigNoz Dashboard
For detailed analysis and further debugging:
- Open your SigNoz dashboard (cloud or local)
- Navigate to Traces to see all agent executions
- Use filters to find specific conversations or agents
- Click on traces to see:
- Step-by-step execution details
- Performance metrics
- Error information
- Agent-to-agent communication flows
For more detailed information on using traces, see the SigNoz Usage guide.
Additional Observability: Langfuse Integration
👉 If you want to connect to Langfuse for specialized LLM observability alongside SigNoz see the Langfuse Usage guide for complete setup instructions.